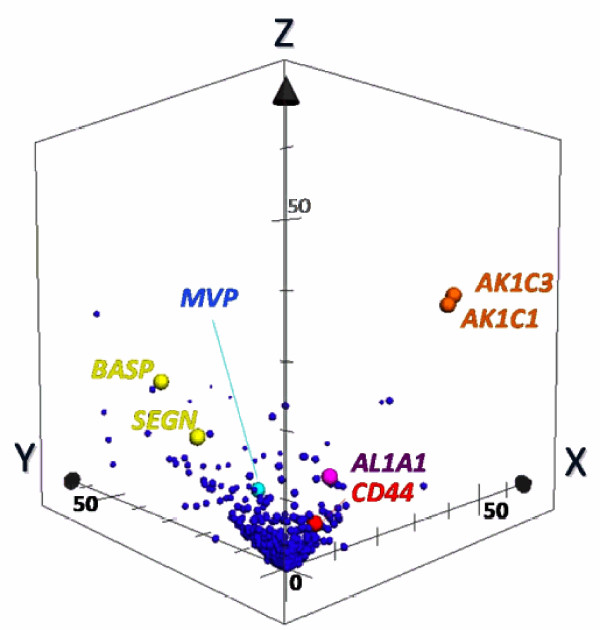
Figure 2.
Marker candidates' extraction by pairwise G statistics. In the 3D scatter plot, X, Y, Z-axis shows G-values (X: LCNEC vs. LCC; Y: LCC vs. SCLC; Z: LCNEC vs. SCLC). Data point sets from 1,918 proteins were plotted with circles. AK1C1 and AK1C3 (orange), AL1A1 (purple) and CD44 (red) Proteins being located very near or on X-Z plane are isolated as candidates of specific LCNEC markers. SEGN (yellow) were located on Y-Z plane, which was already known as one of SCLC-specific markers.

