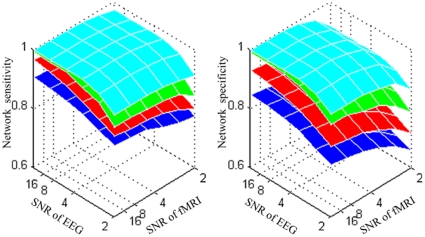
Figure 5. Mean value of sensitivity (proportion of true positive) and specificity (proportion of true negative) over 256 simulations.
Four surfaces show the performance for c = 0.1 (blue surface), c = 0.3 (red surface), c = 0.5 (grey surface), and c = 0.7 (cyan surface), as a function of different noise levels of EEG  and fMRI
  .
.

