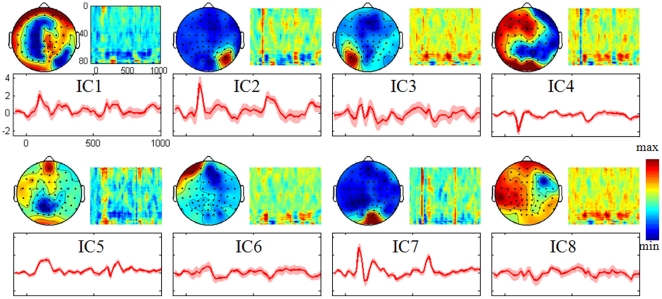
Figure 6. Visualization of the eight functional networks of EEG in real data test.
For each network, three features are shown: scalp topography (top left insert); EEG single trial ERP image (top right insert, trials are smoothed by a 10-trials moving average for visualization); and the average EEG signal change (bottom insert. Red lines = ERP; semitransparent lines = standard error). Axes are the same for all features and are shown on subplot of IC1. IC2 and IC7 are stimulus sensitive functional networks, as their ERPs show a strong activity between 100 and 600 ms. The stimulus onset was at 0 ms, the stimulus reversal occurred at 500 ms.

