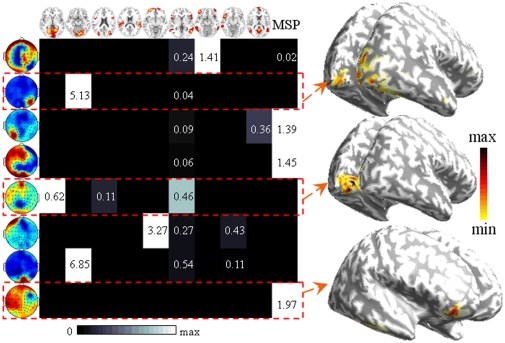
Figure 8. The results of NESOI in real data test.
(a) The hyperparameters quantify the support from fMRI FNs (the topmost panel) to each EEG FN (the leftmost panel). The hyperparameters of FN IC2, 5 and 8 are highlighted with red dashed lines. (b) Three EEG source distribution displayed on the inflated cortex for EEG IC2, 5 and 8. The maps are shown with a threshold of 1% quantile of the spatial distribution.

