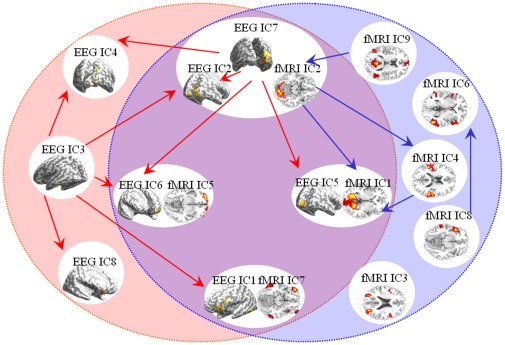
Figure 9. Multimodal functional network connectivity estimated from Granger causality analysis and NESOI in real data test.
The left red and right blue ovals identify the functional networks of EEG and fMRI respectively. The middle intersection area of the red and blue ovals defines the “common substrate” of neuronal activity in the two modalities. Each small white oval represent the matched functional networks. Here the NESOI results on the inflated cortex are adopted as the substitute of the scalp EEG pattern. fMRI FNs are displayed on one slice of the anatomical image respectively. Red arrows depict connections for EEG and blue arrows for fMRI.

