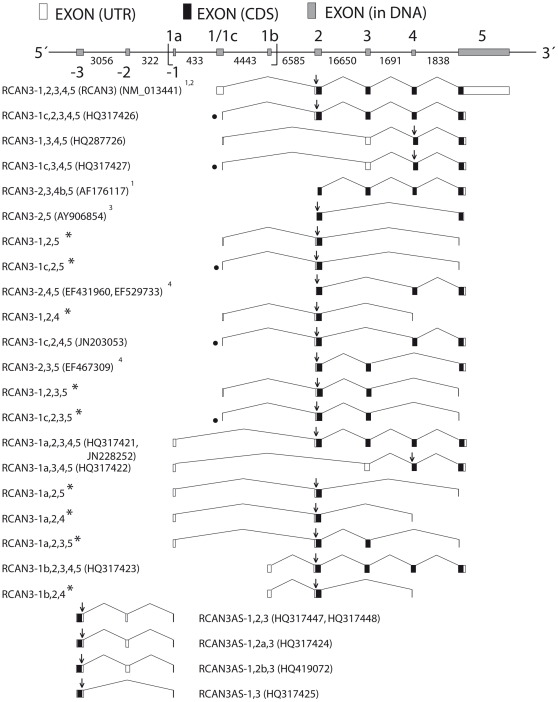
Figure 1. Schematic representation of RCAN3 gene locus: RCAN3 and RCAN3AS isoforms exon-intron organization.
In the DNA scheme, intron sizes (represented not in scale) in base pair (bp) are indicated between the two exons; exon sizes are represented in scale, except for exon -1 (that overlaps with exon 1a on the opposite strand) and exon 1c (that lacks the last 33 bp of exon 1). Exons 1, 2 and 3 are located on the opposite strand. Exons 1 and 5 may not appear in full length in the mRNA diagram due to incompleteness of sequence determination in 5′ or 3′. The diagram, representing mRNAs, shows the longest sequences available to date (see GenBank accession numbers in the figure). In the sense transcripts the direction of translation is to the right and in the antisense transcripts it is to the left. “
 ” indicates the DNA region comprised between 24,828,218 and 24,834,337 nucleotides of the chromosome 1 reference sequence NC_000001: it corresponds to the sequence showed in Figure 5A (see Figure 5A legend). 1 described in Strippoli et al., 2000, 2 described in Strausberg et al., 2002, 3 described in Canaider et al., 2006 and 4 described in Facchin et al., 2008. “*” indicates transcripts for which it was not possible to deposit a relative GenBank file. “•” indicates transcripts with exon 1c. “↓” indicates the start codon.

