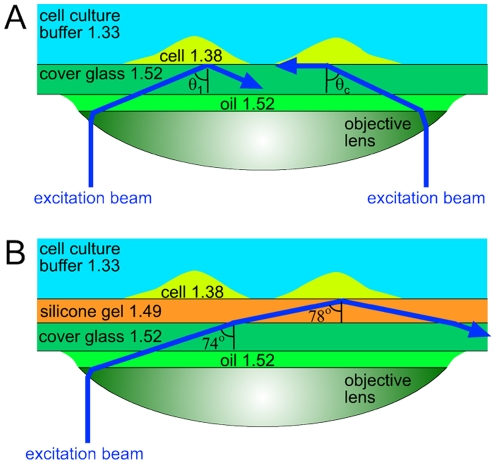
Figure 1. Schematic optical diagrams of through-the-lens TIRF microscopy.
Excitation beams are shown in blue. Numbers indicate refractive indices of different materials found in the setup. (a) TIRF microscopy of adherent cells ( ) on a cover glass (
 ). Excitation beam on the right comes at the critical angle,
  . Excitation beam on the left has an angle of incidence,
  , greater than
  . (b) TIRF microscopy of adherent cells on a thin layer of silicone gel (
 ) on a cover glass. Excitation beam comes at an angle
  , which is the maximal value achievable with an NA = 1.46 TIRF objective, is refracted at the glass-gel boundary to an angle of
  , and is totally reflected at the gel-cell boundary, producing an evanescent wave with a penetration depth,
  nm for
  nm.
nm.

