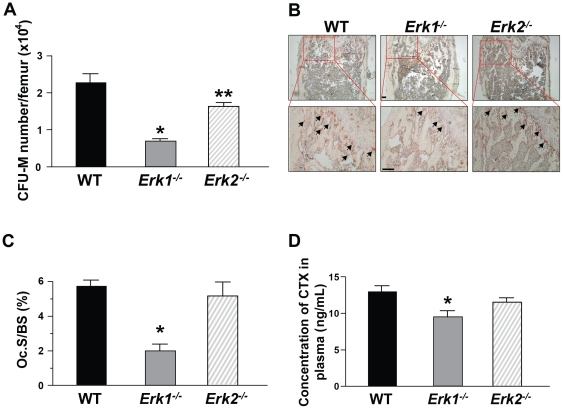
Figure 4. Genetic deletion of Erk1 affects osteoclast progenitor frequency and osteoclast formation in vivo.
(A) BMMNCs of the indicated genotypes were cultured in agar-based media containing M-CSF (30 ng/mL) and RANKL (20 ng/mL) for 7 days and CFU-macrophage (M) were counted based on morphology. Y-axis indicated CFU-M number per femur. Data represents mean ± SEM of triplicate cultures. *P<0.01 for Erk1−/− vs. WT, **P<0.05 for Erk2−/− vs. WT and Erk1−/−, as evaluated by ANOVA followed by post-hoc t-tests. Experiments were conducted on three independent occasions with similar results. (B) Representative microphotographs (40×, 100× magnification) of WT, Erk1−/− and Erk2−/− distal femoral metaphyses following TRACP staining. Arrows indicate selected osteoclasts. Scale bar = 100 µm. (C) Data represent the mean ± SEM of 5 independent experiments. Ten high-power fields per experimental mouse were scored. *P<0.01 for Erk1−/− vs. WT and Erk2−/−, as analyzed by ANOVA followed by post-hoc t-tests. (D) Detection of CTX in plasma of WT, Erk1−/− and Erk2−/− mice (N = 4–6 mice in each group).*P<0.05 for Erk1−/− vs. WT, as analyzed by ANOVA followed by post-hoc t-tests.

