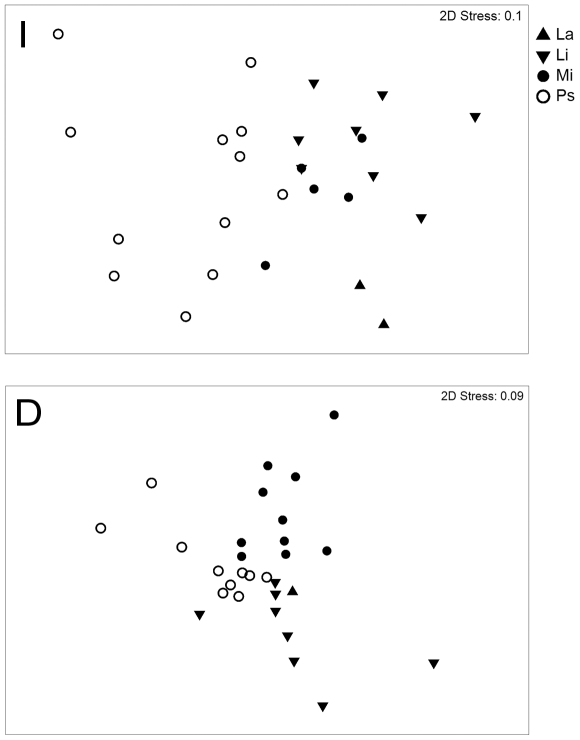
Figure 3. Non-metric Multi Dimensional Scaling (nMDS) ordination comparing interviews outputs across the different study locations.
The position of each dot is defined by the assemblage of species recorded in each interview. La = Lampedusa; Li = Linosa; Mi = Milazzo; Ps = Porto San Giorgio. I = Group ‘INCREASE’; D = Group ‘DECREASE’.

