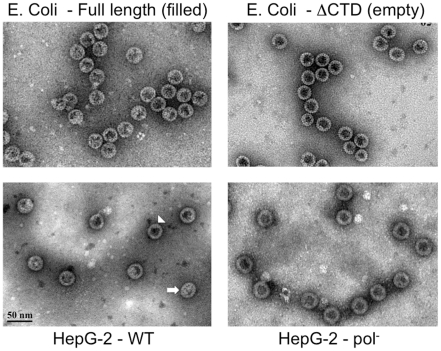
Figure 7. EM of intracellular capsids.
Native HBV NCs purified by sucrose gradient centrifugation from transfected HepG-2 cells (WT, bottom left; Pol-, bottom right) were visualized by EM after negative staining with phosphotungstic acid. E. Coli-derived HBV WT (top left) or C-terminally truncated (at position 144, C144 or ΔCTD; top right) capsids were examined in parallel as (RNA) filled and empty capsid controls, respectively. Two WT capsids with distinct appearances, empty (arrowhead) and filled (arrow), are indicated.

