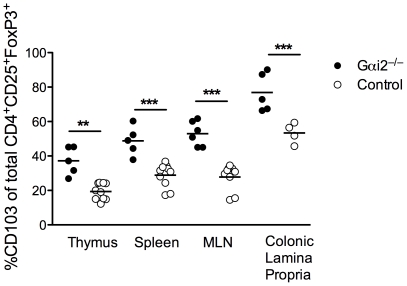
Figure 3. Expression of integrin αE (CD103) on CD4+CD25+FoxP3+ Treg cells from central, peripheral and mucosal lymphoid tissue.
Frequencies of CD4+CD25+FoxP3+ Treg cells in thymus, spleen, mesenteric lymph nodes (MLN) and colon from 5 to 8 weeks old colitic Gαi2−/− mice and age-matched WT littermates. (n≥6 in each group), expressing CD103 were determined by FACS analysis. Gates were set on the CD4+CD25+FoxP3+ subpopulation of lymphocytes. Each symbol represents one mouse and the mean is indicated by a line. Results pooled from at least three independent experiments, where ** = p≤0.01 and *** = p≤0.001.

