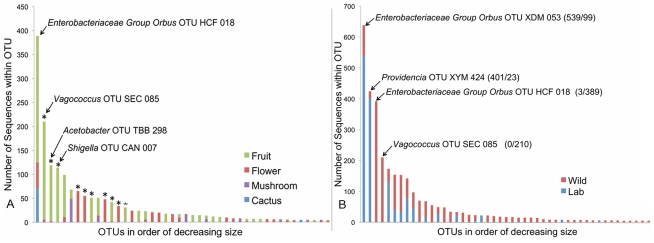
Figure 4. Composition of OTUs.
A. Composition of OTUs within naturally collected flies with respect to diet type. Asterisks indicate OTUs which derive more than 95% of their sequences from a single diet type. OTU names for the four largest OTUs are given. OTUs with fewer than 5 sequences are omitted. B: Composition of all OTUs with respect to sampling environment (i.e. laboratory or wild environment). OTU names and the absolute number of sequences from lab and wild populations, respectively, are given for the four largest OTUs. OTUs with fewer than 5 sequences are omitted.

