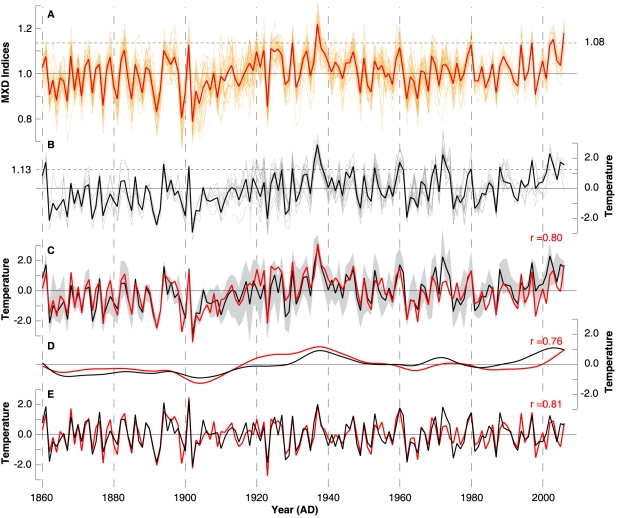
Figure 2. Agreement between high to low frequency variability of the tree-ring proxy and instrumental target data over the past 150 years.
(A) Site and subsets RCS chronologies (orange) and their mean (red). (B) JJA temperatures of eight instrumental stations (grey), and the grid-box mean (black). Dashed horizontal lines and corresponding values indicate the mean of the last decade (1997–2006). (C) Instrumental gridded (black) and reconstructed proxy (red) temperatures superimposed on the min/max range of the station measurements (grey shading), expressed as anomalies from 1961–1990, and split into (D) 20-year low-pass and (E) 20-year high-pass components. Correlation (1860–2006) of the unfiltered and filtered timeseries is shown in red.

