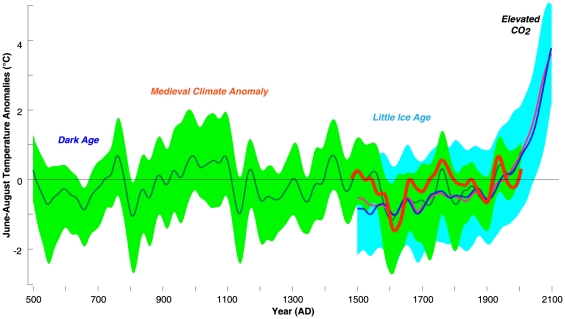
Figure 5. Proxy and model evidence of northern Scandinavian summer temperature variability from 1500–2100 AD.
Reconstructed (red this study and green mean of five existing records) and projected (pink surface air and blue sea surface) temperature anomalies of the 1961–1990 reference period and 60-year low-pass filtered. Green and blue shadings indicate the uncertainty envelopes derived from the annual minimum and maximum values of the various proxy and model data, respectively.

