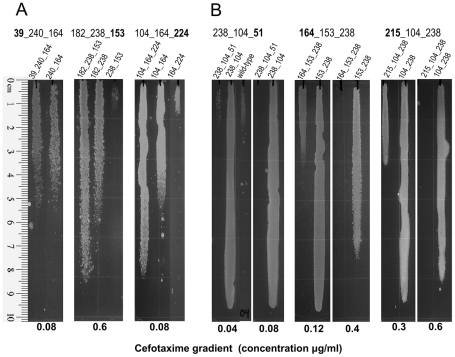
Figure 3. Cefotaxime plate growth assays for selected clones.
Cultures of cells expressing the β-lactamase mutants listed at the top of the gradients were stamped on LB plates containing a cefotaxime gradient. The direction of the gradient is from top (minimal concentration) to bottom (maximal concentration). The maximal concentration of the gradient is listed at the bottom. Note that in part B more than one concentration is shown to cover the wide range of resistance phenotypes of the panel of mutants being tested. (A) Two mutant triplets predicted to be of special significance by our analysis but that were not present in the sequence database used to build the network but were subsequently reported in [36], and a third triplet also predicted by our analysis but that showed only a marginal increase. Only the doublet with the highest level of resistance is shown. (B) Triplets with the strongest negative epistatic effects. The mutation responsible for the negative effect is highlighted in bold.

