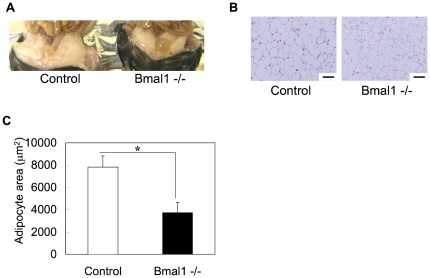
Figure 3. Effects of a high-fat diet feeding on histology of adipocytes in Bmal1 -/- mice.
Adipose tissue was excised at zeitgeber time (ZT) 10. (A) Representative morphology of adipose tissue in control mice and Bmal1 -/- mice fed a HFD for 5 weeks. (B) Representative HE staining of epididymal white adipose tissue isolated from male control mice and Bmal1 -/- mice fed a HFD for 5 weeks. Scale bars indicate 100 µm. (C) Average cross-sectional area of individual adipocytes in control mice and Bmal1 -/- mice fed a HFD. Data represent the means ± SEM (n = 5 for each genotype). Asterisks indicate significant differences (P<0.05).

