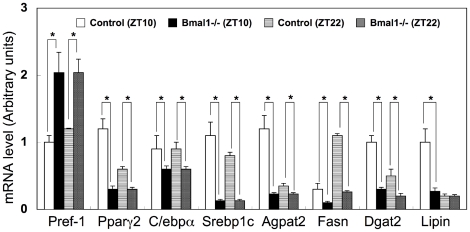
Figure 4. Comparison of gene expressions in adipose tissues.
Gene expressions in adipose tissues in control mice and Bmal1 -/- mice at ZT10 and 22 were determined by RT-qPCR. Relative mRNA levels were normalized to the 36B4 level. Data represents the means ± SEM (n = 5 for each genotype and point). Asterisks indicate significant differences (P<0.05).

