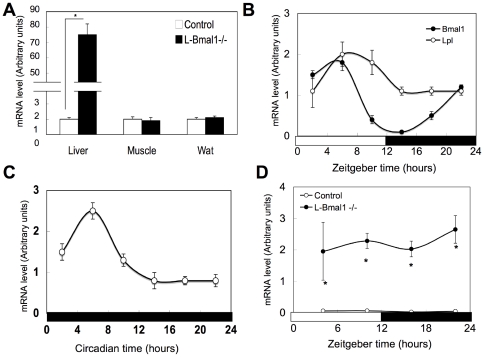
Figure 7. Induction of Lpl gene expression in the liver by the deletion of Bmal1 gene.
(A) Tissue samples were excised form male control mice and L-Bmal1 -/- mice at ZT10. The total RNA was extracted from these tissues and the expression of Lpl mRNA was determined by RT-qPCR. Relative mRNA levels were normalized to the 36B4 level. Data represent the mean ± SEM (n = 5 for each genotype). Asterisks indicate significant differences (P<0.05). Data represent the means ± SEM (n = 5 for each genotype and point). (B) The liver was excised male control mice at the indicated times. The open bar indicates the lights-on phase, and the dark bar indicates lights-off. The total RNA was extracted, and the expression of Bmal1 and Lpl mRNA was determined as described in (A). Data represent the means ± SEM (n = 5 for each point). (C) The liver was excised from the control mice housed in constant darkness for 10 days. The expression of Lpl mRNA was determined as described in (A). Data represent the means ± SEM (n = 5 for each point). (D) The liver was excised male control mice and L-Bmal1 -/- mice at the indicated times. The open bar indicates the lights-on phase, and the dark bar indicates lights-off. The total RNA was extracted, and the expression of Lpl mRNA was determined as described in (A). Data represent the means ± SEM (n = 5 for each genotype and point). Asterisks indicate significant differences (P<0.05).

