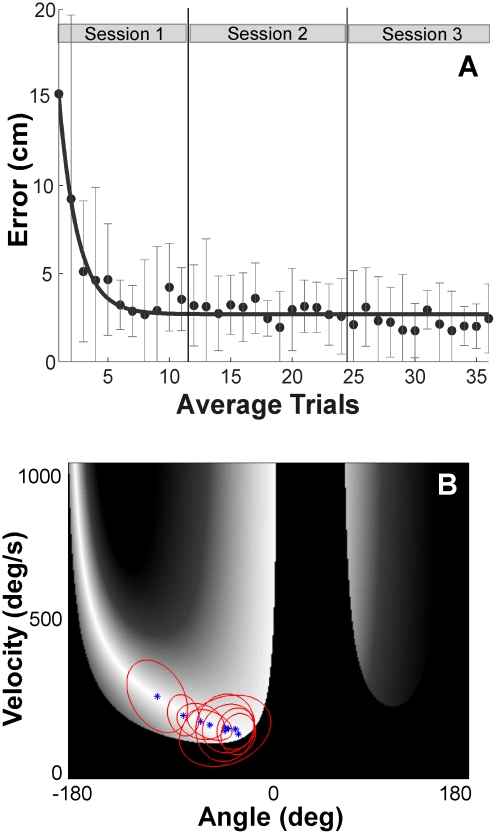
Figure 4. Descriptive results of Experiment 1.
A: Time series of errors (median and interquartile range) averaged across 9 participants. The trials were also averaged such that for every non-overlapping series of 15 trials the median was plotted with the corresponding interquartile ranges shown by the error bars. The line represents an exponential fit to highlight the time course. B: Distribution of trials of individual participants in sessions 2 and 3 plotted in execution space. The 360 trials of each of the 9 participants are represented by the 95% confidence ellipses.

