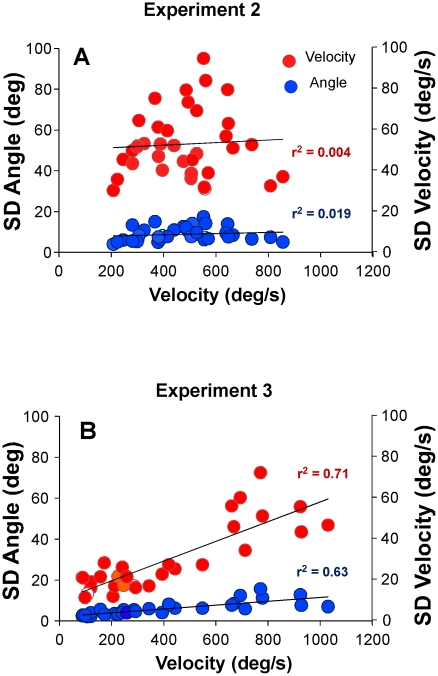
Figure 8. Standard deviations of velocity and angle plotted against their respective mean velocity.
A: Data of all subjects in Experiment 2 (9 participants in 4 sessions with 3 blocks each). The linear regressions did not show any dependency of variability on the velocity. B: Data of Experiment 3 where subjects performed the same throwing movement but without a target. While standard deviations did not scale with increasing mean velocity in Experiment 2, velocity-dependent variability or noise was observed in this Experiment.

