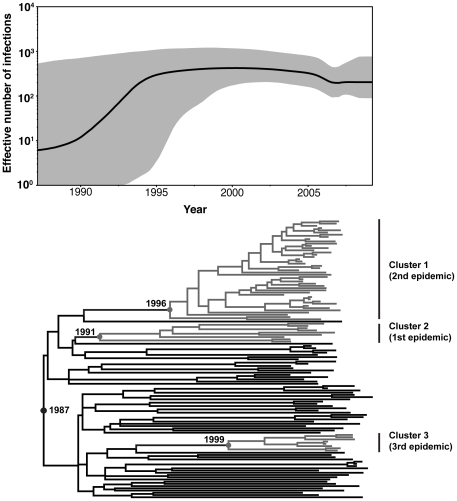
Figure 2. Bayesian Skyline Plot and dated phylogeny of the the Hong Kong MSM HIV-1 subtype B viruses.
Nonparametric reconstruction of the epidemic history with appropiate confidence limits and time-scaled phylogenies of the pol gene are shown. The demographic history of the subtype B virus among Hong Kong MSM represented in black, and the 95% confidence limits of the estimate are represented in grey. The tree represents the phylogenetic relationships of the sequences has the same time scale as the skyline plot.

