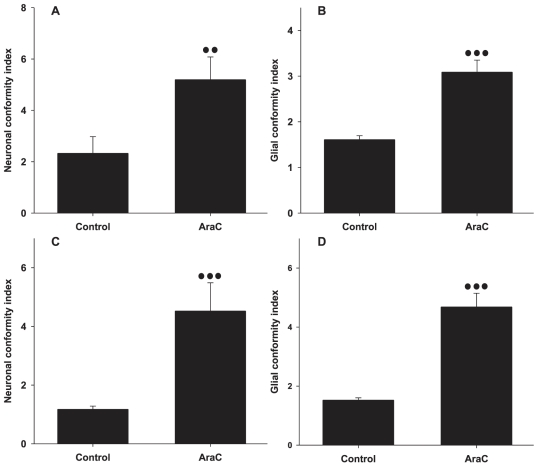
Figure 5. Neuronal and glial conformity to parylene-C stripes in control and AraC treated cultures.
(A) Neuronal conformity at 14DIV. (B) Glial conformity at 14DIV. (C) Neuronal conformity at 21DIV. (D) Glial conformity at 21DIV. Error bars represent the Standard Error of the Means (SEM). Three and two dots represent statistical significance of P≤0.001 and P≤0.01 respectively.

