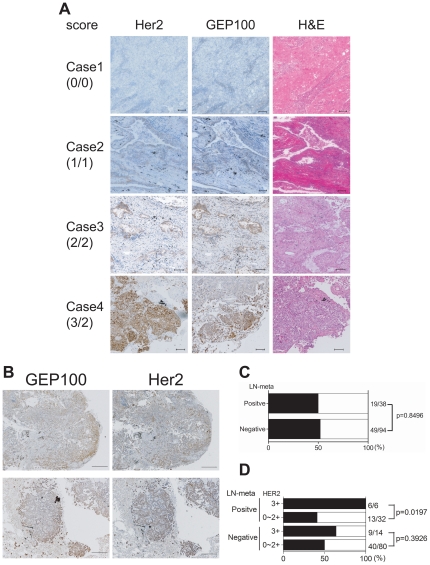
Figure 4. Immunohistochemistry of Her2 and GEP100 in adenocarcinoma lung tissue specimens.
(A) Her2 and GEP100 were each stained in brown in sequential sections. Case 1, Her2 and GEP100 double negative; Case 2, Her2 score 1+ and GEP100 score 1+; Case 3, Her2 score 2+ and GEP100 score 2+; Case 4, Her2 score 3+ GEP100 and GEP100 score 2+. All sections were counterstained with hematoxylin and eosin (H&E) and representative figures are shown. Scale bars, 100 µm. (B) Representative figures of the peripheral expression of GEP100. Scale bars, 500 µm. (C) No correlation between strong expression of GEP100 (score 2+) per se with node-metastases. (D) A statistical correlation between double strong positive signal of GEP100 (score 2+) and Her2 (score 3+), and node-metastases. In C and D, solid bars mean GEP100 positive rate for strong expression (score 2+).

