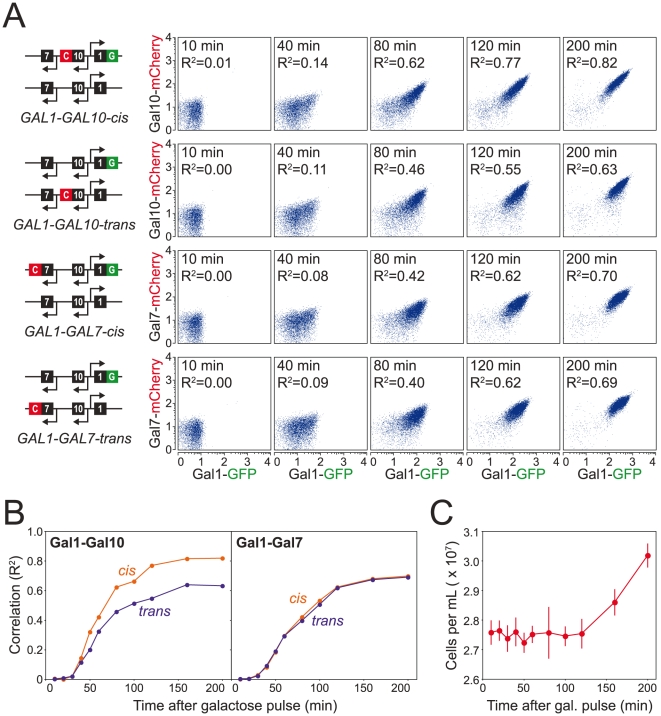
Figure 2. To determine the effect of gene clustering on the coordinated expression of the GAL genes, we monitored production of Gal1-GFP and Gal10-mCherry (or Gal7-mCherry) in both the cis and trans conformations following a 2.5 g/L galactose pulse into a steady-state glucose-limited (0.8 g/L) chemostat[25].
GFP and mCherry were quantified by flow cytometry. (A) Population profiles showing the correlation (R2) between Gal1-GFP and Gal10-mCherry (or Gal7-mCherry) following the galactose pulse. (B) Correlation coefficients (R2) between Gal1-GFP and Gal10-mCherry as a function of time following the galactose pulse. Gal1-GFP and Gal10-mCherry are more correlated in the cis conformation (0.82 at 200 min) compared to the trans conformation (0.63 at 200 min). For Gal1-GFP and Gal7-mCherry, however, we find no difference in the coordination of gene expression between the two conformations (0.70 and 0.69 for cis and trans, respectively at 200 min). The correlation between Gal1 and Gal7 in either conformation is similar to Gal1-Gal10 in the trans conformation. (C) The average cell density (± one standard deviation) for all eight populations following the galactose pulse as measured by Coulter counter. Although the Gal proteins were detectable 30 minutes, cell number did not increase until 120 minutes subsequent to the galactose pulse.

