FIGURE 3.
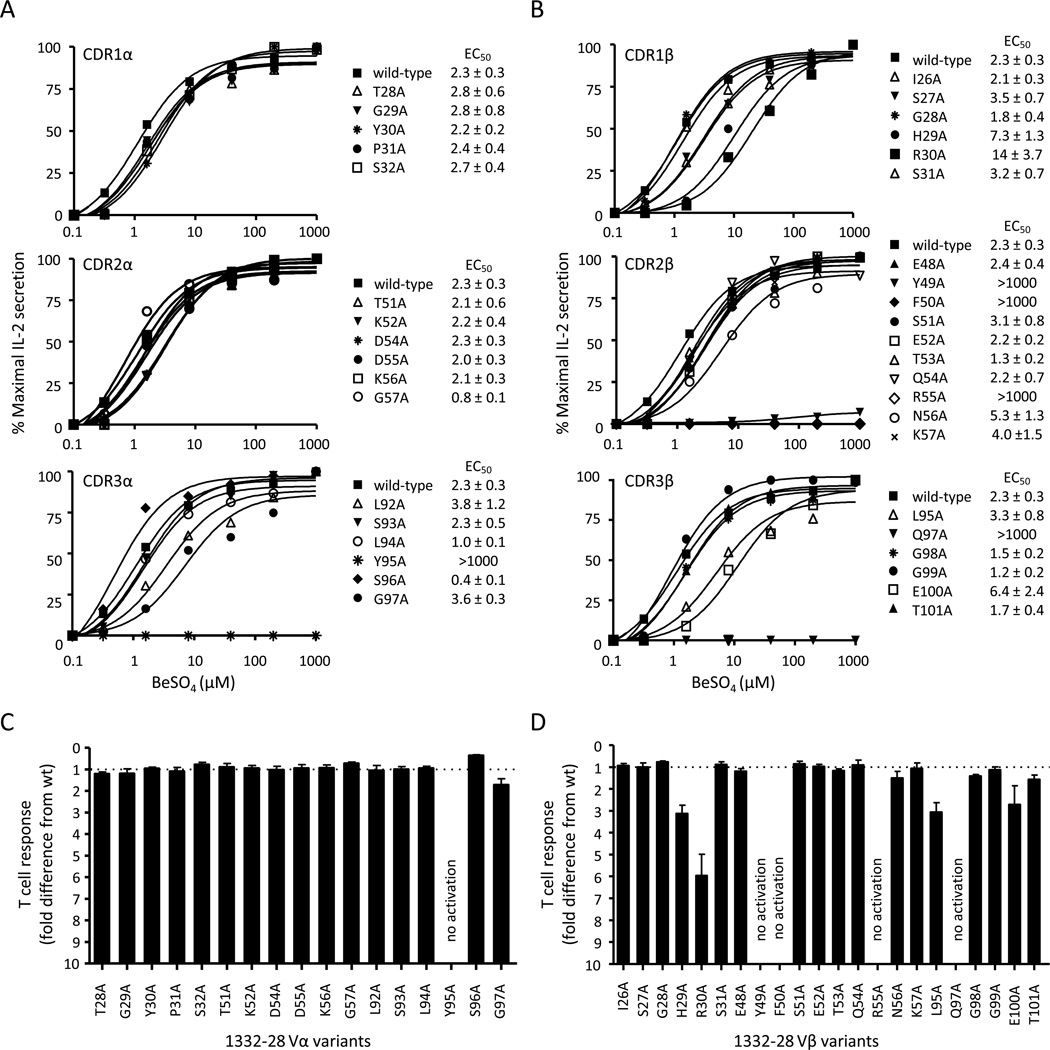
Contact sites of the Be-responsive TCR, 1332-28, with the HLA-DP2/peptide/Be complex. Be-specific response of T cell hybridoma 1332-28 expressing wild-type TCR and TCR variants with single-site alanine mutations at each amino acid position of the CDR1 (upper panel), CDR2 (middle panel) and CDR3 (lower panel) of Vα22 (A) and Vβ5.1 (B). TCRs were expressed on 5KC and stimulated with various concentrations of BeSO4 presented by HLA-DP2-transfected murine fibroblasts. IL-2 secretion was measured by ELISA and plotted as % maximal IL-2 secretion against BeSO4 concentration. Activation curves are representative of three independent experiments, and EC50 values (the concentration of BeSO4 required for a half-maximal T cell hybridoma response) were determined by non-linear regression of the activation curves using Graph Pad Prism software. The mean ± SEM EC50 values for the wild-type TCR and each of the variants are shown. The overall EC50 fold-change difference (mean ± SEM) for the TCR α-chain (C) and β-chain (D) variants compared to the wild-type TCR is shown. The dotted line at y = 1 represents the wild-type TCR response.

