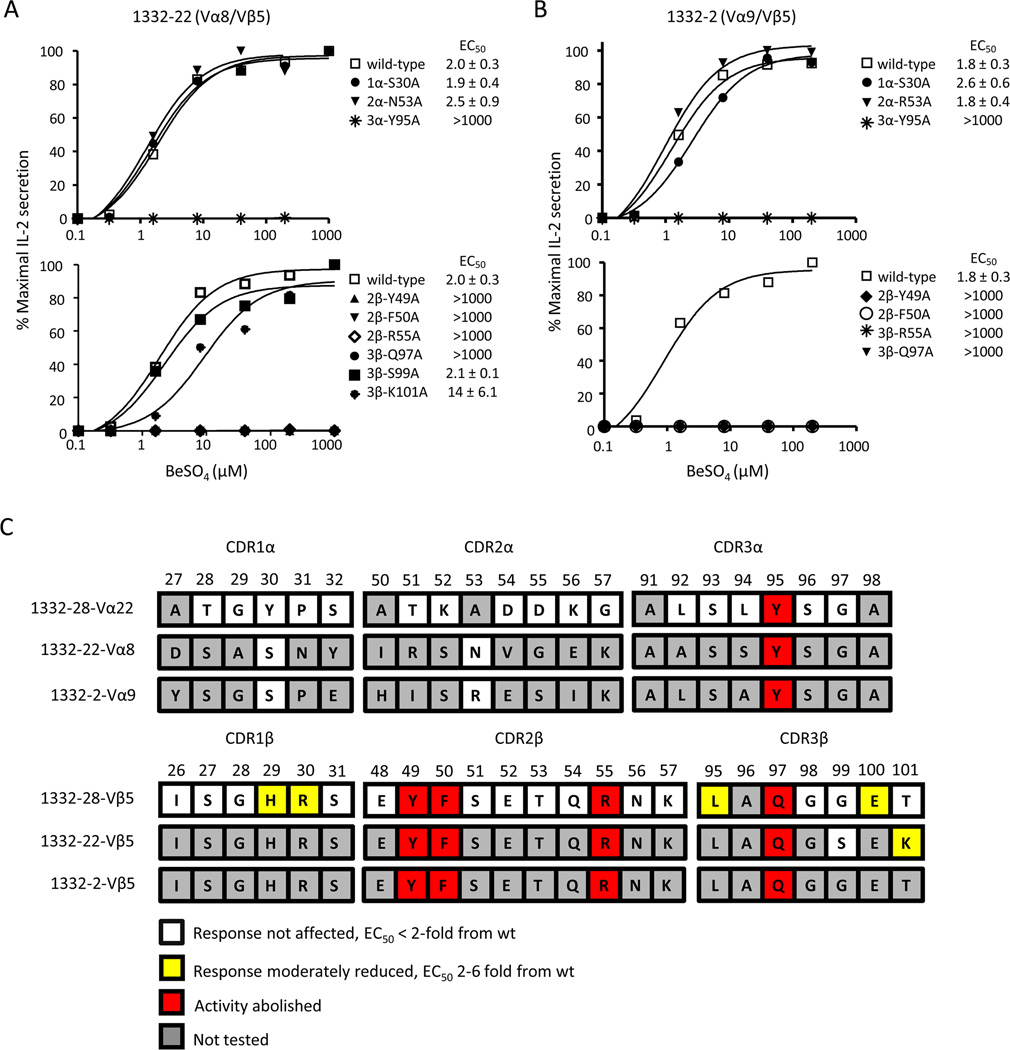
FIGURE 4.
Vβ5+ TCRs recognize the HLA-DP2/peptide/Be complex using identical contact sites. A and B Stimulation of Be-specific T cell hybridomas, 1332-22 and -2, expressing selected mutations in the CDRs of the TCR α- and TCR β-chains with HLA-DP2-expressing DAP.3 fibroblasts and various concentration of BeSO4. T cell secretion of IL-2 was measured by ELISA and plotted as described in Figure 3. Activation curves are representative of three independent experiments. The mean ± SEM EC50 values for the wild-type TCR and each of the variants are shown. C, A color-coded summary of T cell activation data for the stimulation of T cell hybridomas 1332-28, -22, and -2. TCR CDR amino acid sequences for each of the three T cell hybridomas are aligned with the amino acid sequence number shown above. Residues are highlighted based on their effect when mutated to alanine, in comparison to the wild-type response. Residues highlighted in white indicate that an alanine mutation had no effect on T cell response, with EC50 values identical to the wild-type response. Residues highlighted in yellow indicate a mutation that had a moderate effect on T cell hybridoma response, 2–6-fold reduction in response compared to wild-type. Residues highlighted in red indicate the absence of a hybridoma response when mutated to alanine.

