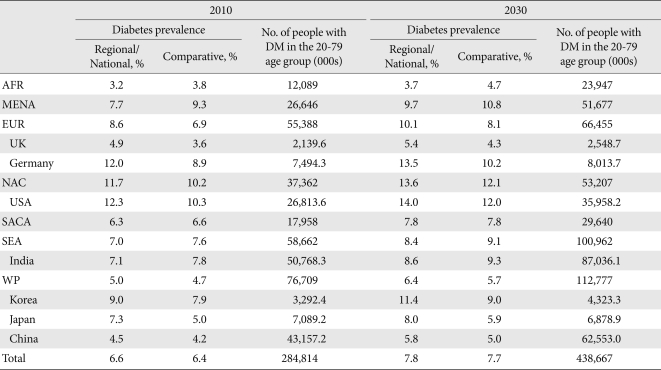
Table 4.
Estimates of diabetes prevalence in 2010 and 2030
Regional/National: crude total population rates. Comparative: rates were adjusted to the age/sex composition of the world population to make regions more directly comparable. The data presented for adults are for types 1 and 2 diabetes combined. Data from Diabetes atlas. 4th ed. [21].
AFR, Africa; MENA, Middle East and North Africa; EUR, Europe; NAC, North America and Caribbean; SACA, South and Central America; SEA, Southeast Asia; WP, Western Pacific.

