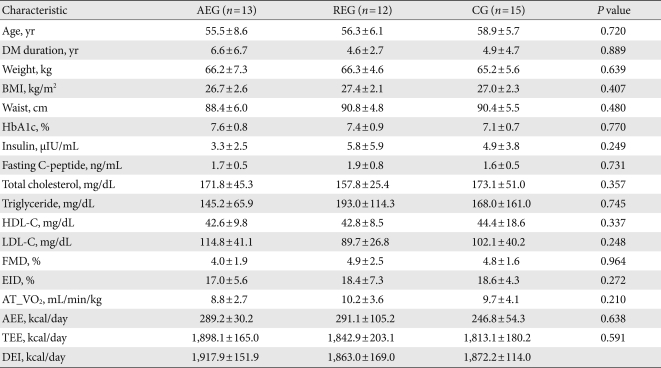
Table 1.
Clinical characteristics of study subjects at baseline
Values are presented as mean±standard deviation. P values were calculated from ANOVA test among 3 groups.
AEG, aerobic exercise group; REG, resistance exercise group; CG, control group; DM, diabetes mellitus; BMI, body mass index; HbA1c, glycosylated hemoglobin; HDL-C, high density lipoprotein cholesterol; LDL-C, low density lipoprotein cholesterol; FMD, flow-mediated vasodilation; EID, endothelium independent vasodilation; AT_VO2, oxygen uptake at anaerobic threshold; AEE, activity energy expenditure; TEE, total energy expenditure; DEI, dietary energy intake.

