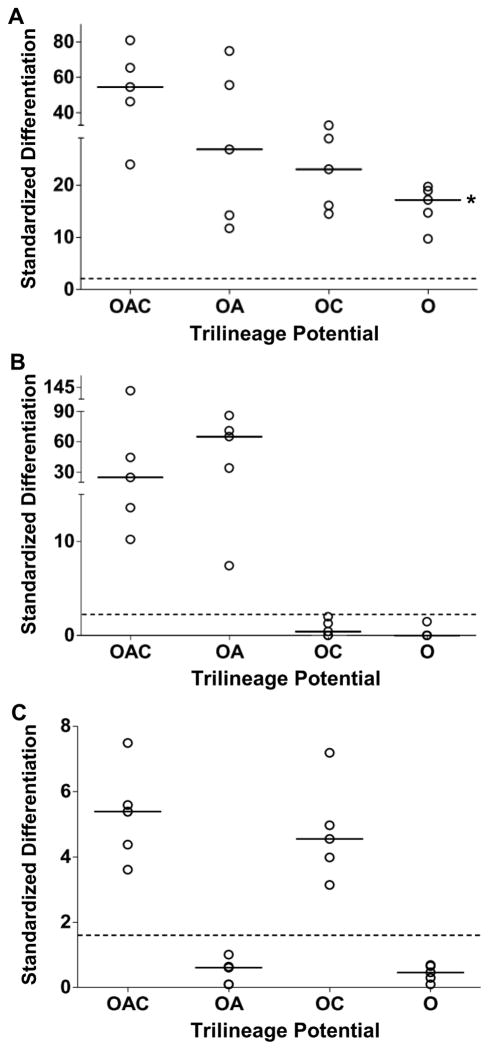
Figure 2.
Representative potency of amplified MSC clones. Trilineage potential of clones was verified upon inoculating experimental cultures. Three matched cultures per clone were stained after 21 days in differentiation medium with Alizarin Red S to detect mineralization of extracellular matrix (A); AdipoRed, lipids (B); and 1,9-dimethylmethylene blue, sulfated GAGs (C). Negative control: MSCs in CCMA. Dimensionless differentiation scores were standardized relative to the mean ± standard deviation for the negative controls of 0.19 ± 0.04 absorbance units (A), 2200 ± 400 relative fluorescence units (B), and 0.26 ± 0.07μg GAG/μg DNA (C). Threshold values for positive differentiation (dashed lines) correspond to the 95th percentile of the probability density for the negative controls. Nomenclature: CCMA, cell culture medium with antibiotics; GAG, glycosaminoglycans; OAC, osteo-adipo-chondrogenic; OA, osteo-adipogenic; OC, osteo-chondrogenic; O, osteogenic. Median (__, n=5 clones). *, P < 0.05 vs. OAC clones.

