
Figure I.
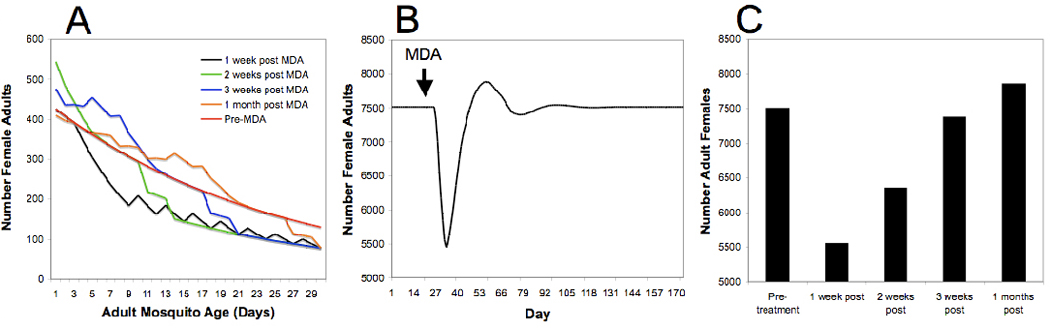
A model of female adult Anopheles gambiae age structure and abundance following an ivermectin mass drug administration. (a) Models of combined age structure and abundance prior to mass drug administration (Pre-MDA, red line), and 1–4 weeks post MDA (black, green, blue and orange lines, respectively). (b) The modeled effect of a single MDA on female adult abundance over time. (c) Discrete number output of the abundance model on a weekly timescale. Derived from [14].