Figure 5.
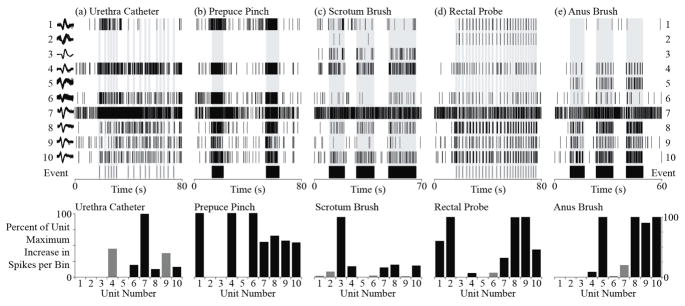
Examples of DRG units responsive to different perineal stimuli. At the top, raster plots for ten units (1–10, top to bottom) and the corresponding event markers are shown for (a) movements of the urethral catheter, (b) pinching of the prepuce, (c) brushing of the scrotum, (d) movement of the rectal probe and (e) brushing of the anus. Some units were clearly associated with more than one stimuli (units 1, 4, 6–10) while other units responded only to a single test (units 2, 3, 5). At the bottom, the increase in spike rate during each trial is normalized to the maximum value across trials for each unit. Black bars indicate units with significantly greater spike counts during the stimulus, according to a Wilcoxon rank-sum test with a Bonferroni correction (p < 0.0005), for each trial. Grey bars indicate units with non-significant increases in spike counts for that trial. Units 1–5 were from S2 while units 6–10 were from S1 in Cat 2.

