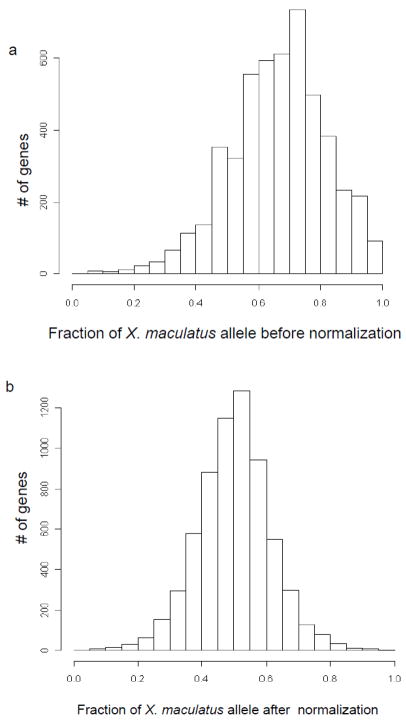
Figure 3.
Allele distribution in F1 hybrid background. A: A histogram shows the distribution of F1 transcripts carrying different parental alleles before normalization. X axis is the fraction of reads carrying X. maculatus allele. 0.5 means in that gene, half of F1 hybrid reads can be identified from X. couchianus and another half are from X. maculatus. 1.0 and 0.0 means reads exclusively carrying X. maculatus and X. couchianus alleles, respectively. B: Fraction of X. maculatus in hybrid background after normalization. We masked X. maculatus reference with consensus bases from X. couchianus and allowing five mapping mismatches.

