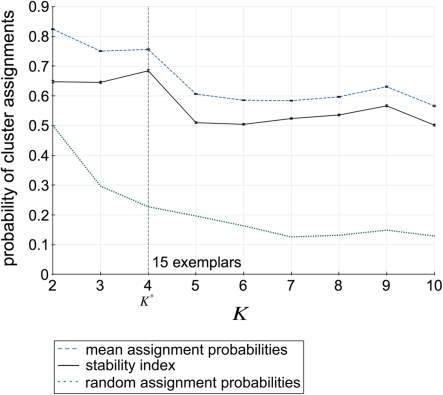
Figure 5.
Assignment probabilities plotted against the number of global clusters K. Dashed plot shows the mean assignment probability based upon the maximum likelihood mapping. Dotted plot shows the random cluster assignment probabilities. The stability index (Fischer and Buhmann, 2003) used to select the number of clusters K* is the relative difference between mean and random cluster assignment probabilities (solid plot). The most stable partitioning K* is given by the preferred grouping of 15 cortical subunits, characterized by 15 exemplars, into four global cortical structures.

