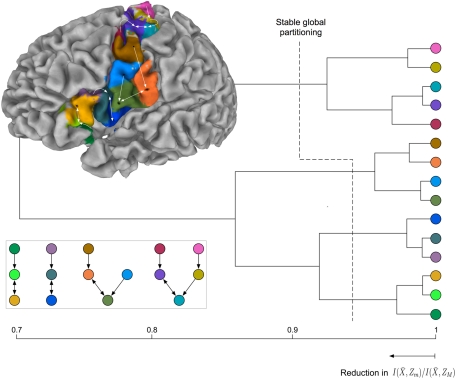
Figure 7.
Hierarchical tree of the nested hierarchical structure constructed by the agglomerative information bottleneck method (Slonim and Tishby, 1999). The cardinality of the initial partition equals the number of exemplars, M = 15. The length of each branch gives the normalized information loss due to merging operations. Bottom left: Internal organization of representative tractograms within four global cortical structures obtained by SCAP. Top left: Cortex parcellation showing the finest level of detail. Black dots indicate the location of exemplars while arrows show the preferred grouping of cortical subunits obtained by SCAP.

