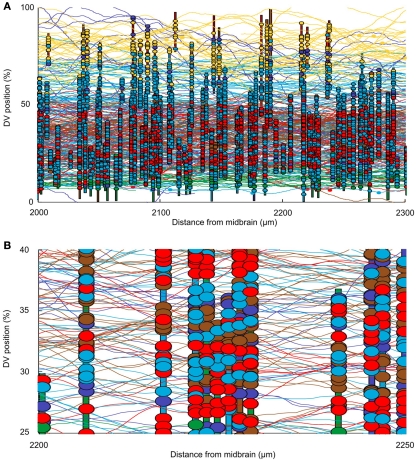
Figure 4.
Visualizing the connectome. (A) A 300-μm long region of the connectome showing the network on one side of the spinal cord. Note: this is ∼10% of the longitudinal extent of the model. Vertical colored bars indicate the dendrites of individual neurons; horizontal curved lines indicate the trajectories of grown axons. Dendrites and axons are color coded for cell type as in Figure 1. Small colored ellipses indicate individual synaptic contacts. In each case, the contact is color coded according to the presynaptic cell type. (B) A small fragment of one side of the connectome, color coded as in (A).

