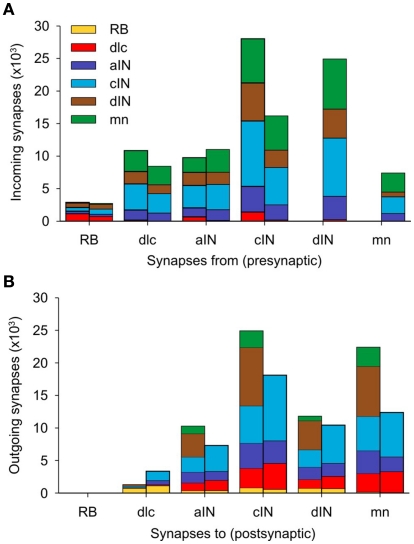
Figure 7.
Distribution of synapses in a single connectome model. (A) For each neuron type, the two stacked columns show outgoing synapses onto all other neuron types; post-synaptic neuron types (color coded as in Figure 1A) receive incoming synapses from descending axons (right columns) and ascending axons (left columns). (B) Like (A), but each stacked column shows the distribution of incoming synapses from all other cell-types, made via descending axons (left columns) and ascending axons (right columns). See Table 2 for data.

