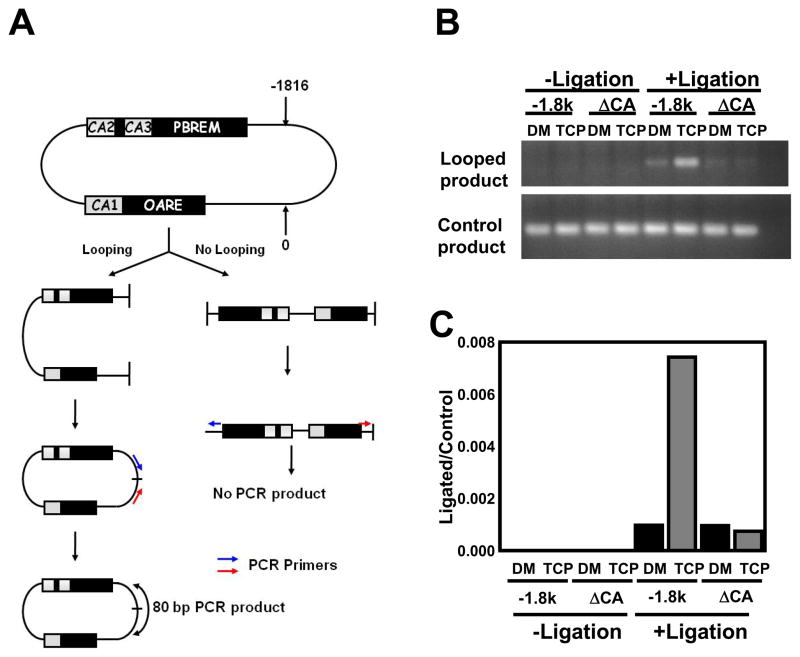
Figure 4. Chromatin conformation capture.
(A) Schematic representation of the 3C experimental procedure. The numeric numbers 0 and −1816 indicate the XhoI cutting sites. Arrows indicate the position of PCR primers and double arrow indicates the position of the PCR amplicon. (B) The −1.8kb CYP2B6 (−1.8kb) and ΔCA123 CYP2B6 (ΔCAs) promoters were incubated with nuclear extracts prepared from Ym17 cells treated with DMSO (DM) or TCPOBOP plus PMA (TCP). After incubation, the reaction mixture was divided into two parts, of which one was ligated, while the other was unligated. Degrees of ligation were estimated by PCR amplification using two sets of primers for looped and linear products, respectively on an ethydium bromide-stained 1.5% agarose gel. (C) The same ligated and unligated samples used in Fig. 4A were subjected for real time PCR.

