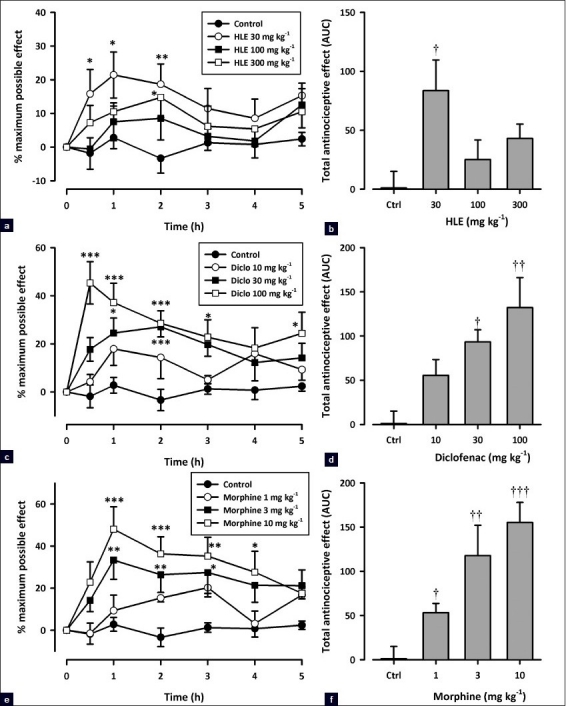
Figure 2.

Effect of HLE (30–300 mg/kg, p.o.), diclofenac (10–100 mg/kg, i.p.), and morphine (1–10 mg/kg, i.p.) on the time course curve (a, c, and e) and the AUC (b, d, and f) of the tail immersion test in rats. Data are presented as mean ± SEM (n=5). *P<0.05, **P<0.01, and ***P<0.001 compared to the vehicle-treated group (two-way ANOVA followed by Bonferroni's post hoc test). †P <0.05, ††P<0.01, and †††P<0.001 compared to the vehicle-treated group (one-way ANOVA followed by the Newman–Keuls post hoc test)
