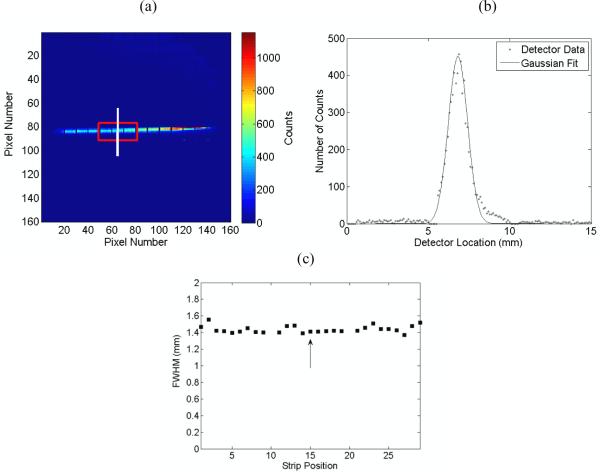
Figure 4.
The results of our spatial resolution characterization using a Cobalt-57 source aligned with a 116 micron slit. (a) A slit image with a box encompassing three strips where FWHMs were measured along the vertical axis. (b) A line profile constructed from the oversampled slit images centered at the vertical line in (a). This oversampled line profile was fitted to a Gaussian curve and used to calculate the FWHM at one position. (c) A plot showing the FWHM measurements across the box region in (a). The arrow in (c) represents the position of the vertical line in (a).

