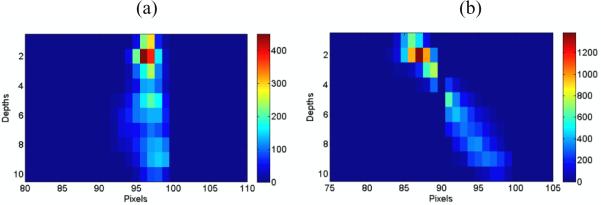
Figure 5.
Lateral position versus depth plots demonstrating the depth of interaction estimation capabilities of the HPGe detector when the source is on axis with the pinhole (a) and when the source is 7 cm off axis with the pinhole, making a 35o angle of incidence with the detector (b). Ten 1-mm depth bins are clearly seen in (b) with a vertical gap at pixel 90 corresponding to the gap between strips. Note that the count levels are different in the two images because the two acquisitions were not equal in duration.

