
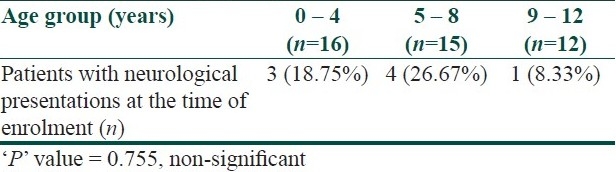
Table 2.
shows the proportion of neurological presentation in different age groups at the time of enrolment
Official websites use .gov
A
.gov website belongs to an official
government organization in the United States.
Secure .gov websites use HTTPS
A lock (
) or https:// means you've safely
connected to the .gov website. Share sensitive
information only on official, secure websites.
shows the proportion of neurological presentation in different age groups at the time of enrolment