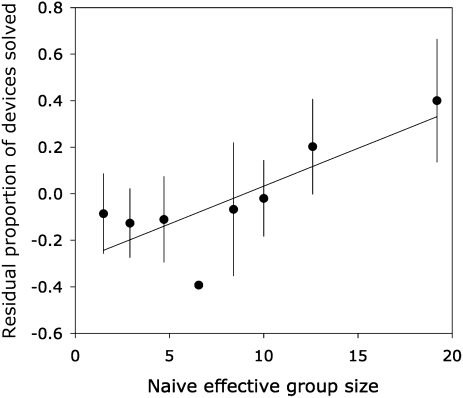
Fig. 3.
Residual proportion of devices solved (mean ± SEM) by naive individuals in relation to the total number of naive individuals in the group, with linear fit shown. Plotted values are residuals from a binomial GLMM of proportion of solved devices for naive group effort, with day nested within location as a random effect (n = 161, split into seven categories of 20 and one category of 21 data points each; 1 trial out of the 162 had no attempt by naive individuals and was therefore excluded from the analysis).

