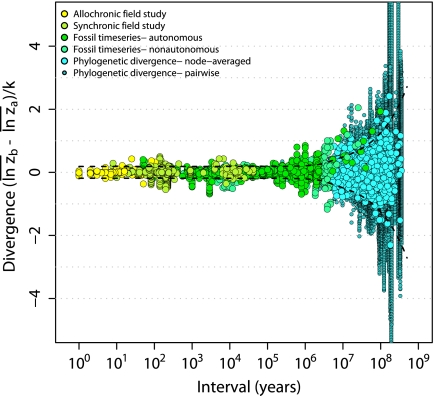
Fig. 1.
The “blunderbuss pattern”, showing the relationship between evolutionary divergence and elapsed time. Divergence is measured as the difference between the means of log-transformed size in two populations ( and
and  ) standardized by the dimensionality, k. Intervals represent the total elapsed evolutionary time between samples. Microevolutionary data include longitudinal (allochronic) and cross-sectional (synchronic) field studies from extant populations. Paleontological divergence is measured from time series, including both stratigraphically adjacent (autonomous) populations and averaged longer-term trends (nonautonomous). We supplement these data with node-averaged divergence between species with intervals obtained from time-calibrated phylogenies. Pairwise comparisons between species (small points) are also presented to give a visual sense of the range of divergence values across taxonomic groups. Dotted lines indicate the expected 95% confidence interval for the multiple-burst model fitted to the microevolutionary, fossil, and node-averaged phylogenetic data.

