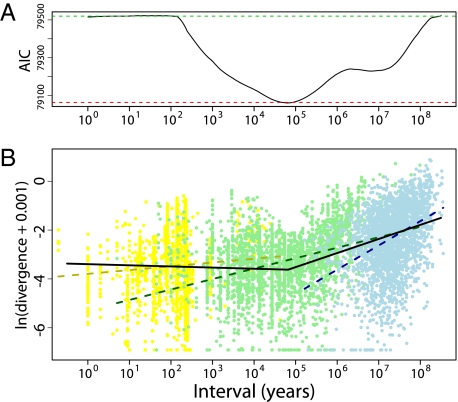
Fig. 4.
Linear regressions of interval on the logarithm of absolute divergence, ln(|divergence| + 0.001). A positive linear relationship is predicted from Brownian-motion models of evolution. (A) AIC scores for the fit of the microevolutionary, fossil, and node-averaged phylogenetic data to linear regressions. The fit of a single linear regression to the entire dataset is the most poorly fitting model (green dashed line, AIC = 79,520). We then performed a segmented regression to find the optimal breakpoint by fitting the model iteratively while increasing the breakpoint from 0 to 8.5 log10 y with a step size of 0.01 (solid black line). The AIC for this model reaches a minimum with a breakpoint of 104.82 years (AIC = 79,059). Subsetting by datasets and fitting a regression independently to each did not improve the fit relative to the segmented regression (red dashed line, AIC = 79,062). (B) Best-fit segmented regression model provides a better fit to the data (solid line) than a model where independent linear regressions are fitted to each dataset (dashed lines). Datasets and the corresponding regression lines are indicated by color (microevolutionary, yellow; fossil, green; and phylogenetic, blue).

