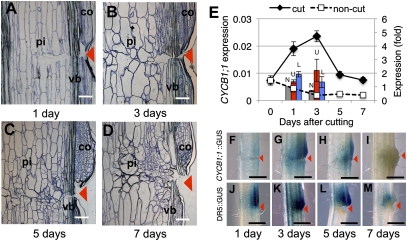
Fig. 1.
Process of tissue reunion in the wounded flowering stem of Arabidopsis. (A–D) Light micrographs of the tissue-reunion process. Arrowheads indicate position of the cut. pi, pith; co, cortex; vb, vascular bundle. (E) Expression of Cyclin B1;1. Each value is the mean ± SE (n = 3). Bars show comparative expression between upper (U; red bar) or lower regions (L; blue bar) of cut stem. The noncut (N; gray bar) control was arbitrarily set to 1, and the mean ± SE is shown (n = 4). (F–I) pCyclin B::GUS plants. (J–M) DR5::GUS plants. Photographs were taken at 1 d (A, F, and J), 3 d (B, G, and K), 5 d (C, H, and L), and 7 d (D, I, and M) after cutting. (Scale bars, 100 μm in A–D, 1 mm in F–M.)

