Fig. 4.
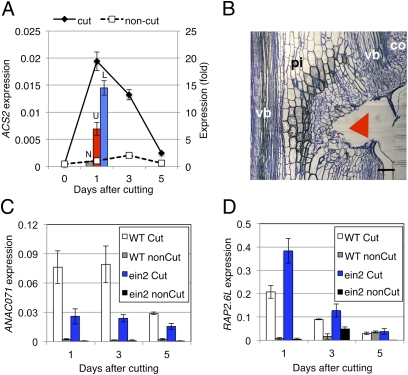
Involvement of ethylene in tissue reunion and expression of RAP2.6L and ANAC071. (A) Expression of ACS2. For time-course analysis, the mean ± SE is shown (n = 3). Bars show comparative expression between upper (U; red bar) and lower region (L; blue bar) of cut stem. The noncut (N; gray bar) control was arbitrarily set to 1, and the mean ± SE is shown (n = 4). (B) Light micrograph of ein2 cut stem. Images were taken 7 d after cutting. Arrowheads indicate position of cut. pi, pith; co, cortex; vb, vascular bundle. (Scale bar, 100 μm.) The image is a composite to form the complete figure. (C and D) Relative expression of ANAC071 (C) and RAP2.6L (D) in cut stem (white bar) or noncut stem (gray bar) of wild type, and cut stem (blue bar) or noncut stem (black bar) of ein2. Mean ± SD (n = 2) is shown.

