Fig. 5.
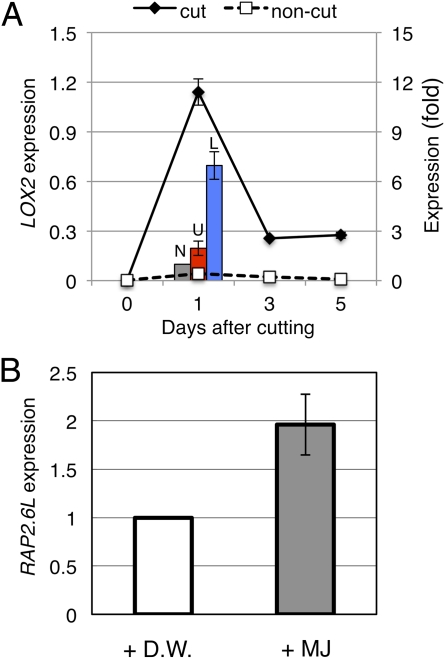
Regulation of RAP2.6L expression by JA. (A) Gene expression of LOX2. For time-course analysis, the mean ± SE is shown (n = 3). Bars show comparative expression between upper (U; red bar) and lower region (L: blue bar) of cut stem. The noncut stem control (N; gray bar) was arbitrarily set to 1, and the mean ± SE is shown (n = 4). (B) Effects of methyl jasmonate (MJ) application on the expression of RAP2.6L in the intact flowering stem. The distilled water (D.W.) control was arbitrarily set to 1, and the mean ± SE is shown (n = 3).

