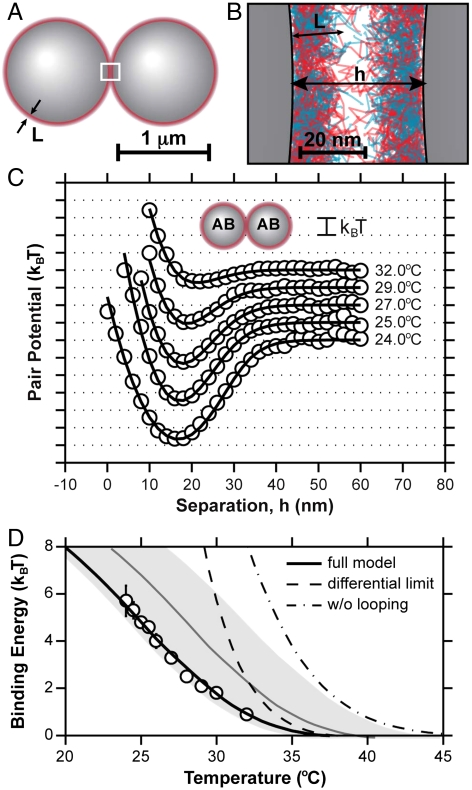
Fig. 4.
Models and experiments for mixed DNA brushes. (A) Each of the A-B type spheres is labeled with both oligonucleotides, forming a mixed brush, rendered in (B). Measured pair-interaction potentials (C) for two A-B type spheres (circles) with associated model (solid curve), both vs. temperature. (D) Binding energy as a function of temperature. The circles are experimental measurements, each averaged over five pairs. Error bars are determined from the standard error among different pairs. The full interaction model is the solid curve, the dashed curve assumes a differential reaction approximation, and the dot-dashed curve assumes all hybridized strands are bridges. The gray band is the full interaction model solution using the NN prediction for  (gray curve) delimited by
  .
.

