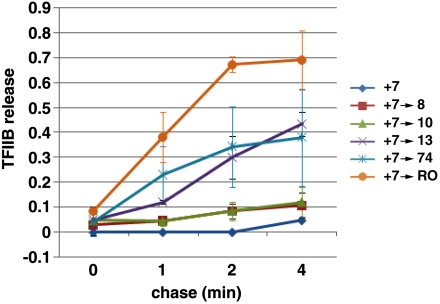
Fig. 4.
TFIIB becomes destabilized within the EC when the transcript is extended from 7 to 13 nt. Quantitative analysis of two or three (+7 → 10) independent experiments on TFIIB release over a 4-min time course. The fraction of TFIIB lost is shown for complexes advanced from +7 to the indicated positions, with the TFIIB level in the 7-mer complex set to 1. The values plotted show the averages +/- the range, or +/- SD for the +7 → 10 test. Examples of the primary data are shown in Fig. S1.

