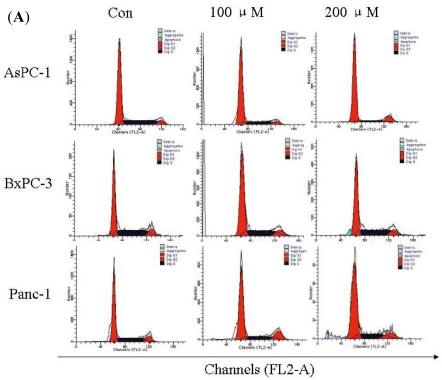
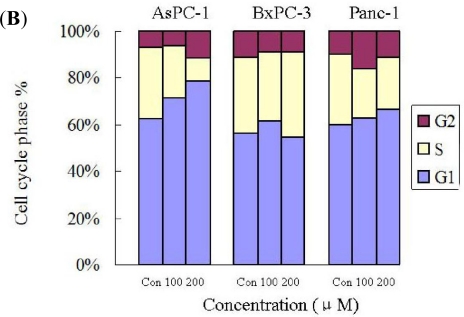
Figure 4.
Silibinin triggers cell cycle arrest. (A) The DNA content of cells treated with Silibinin for the indicated times was analyzed by flow cytometry. Cell-cycle distributions after treatment with 100, 200 μM Silibinin for 24 h. DMSO as the negative control. Cell-cycle distributions were assessed by PI staining. The DNA content of 15,000 events was analyzed by flow cytometry; (B) The number of G1, S and G2 phase cells from Figure 4A.


